 |
|

|
From Orford Ness to Goseford Changes from c1200 to c1600 Page 1 of 1 This page contains conjectural maps of the coastal changes described in the following article:- "The Transformation of the Suffolk Coast c1200 to c1600 from Orford Ness to Goseford" |
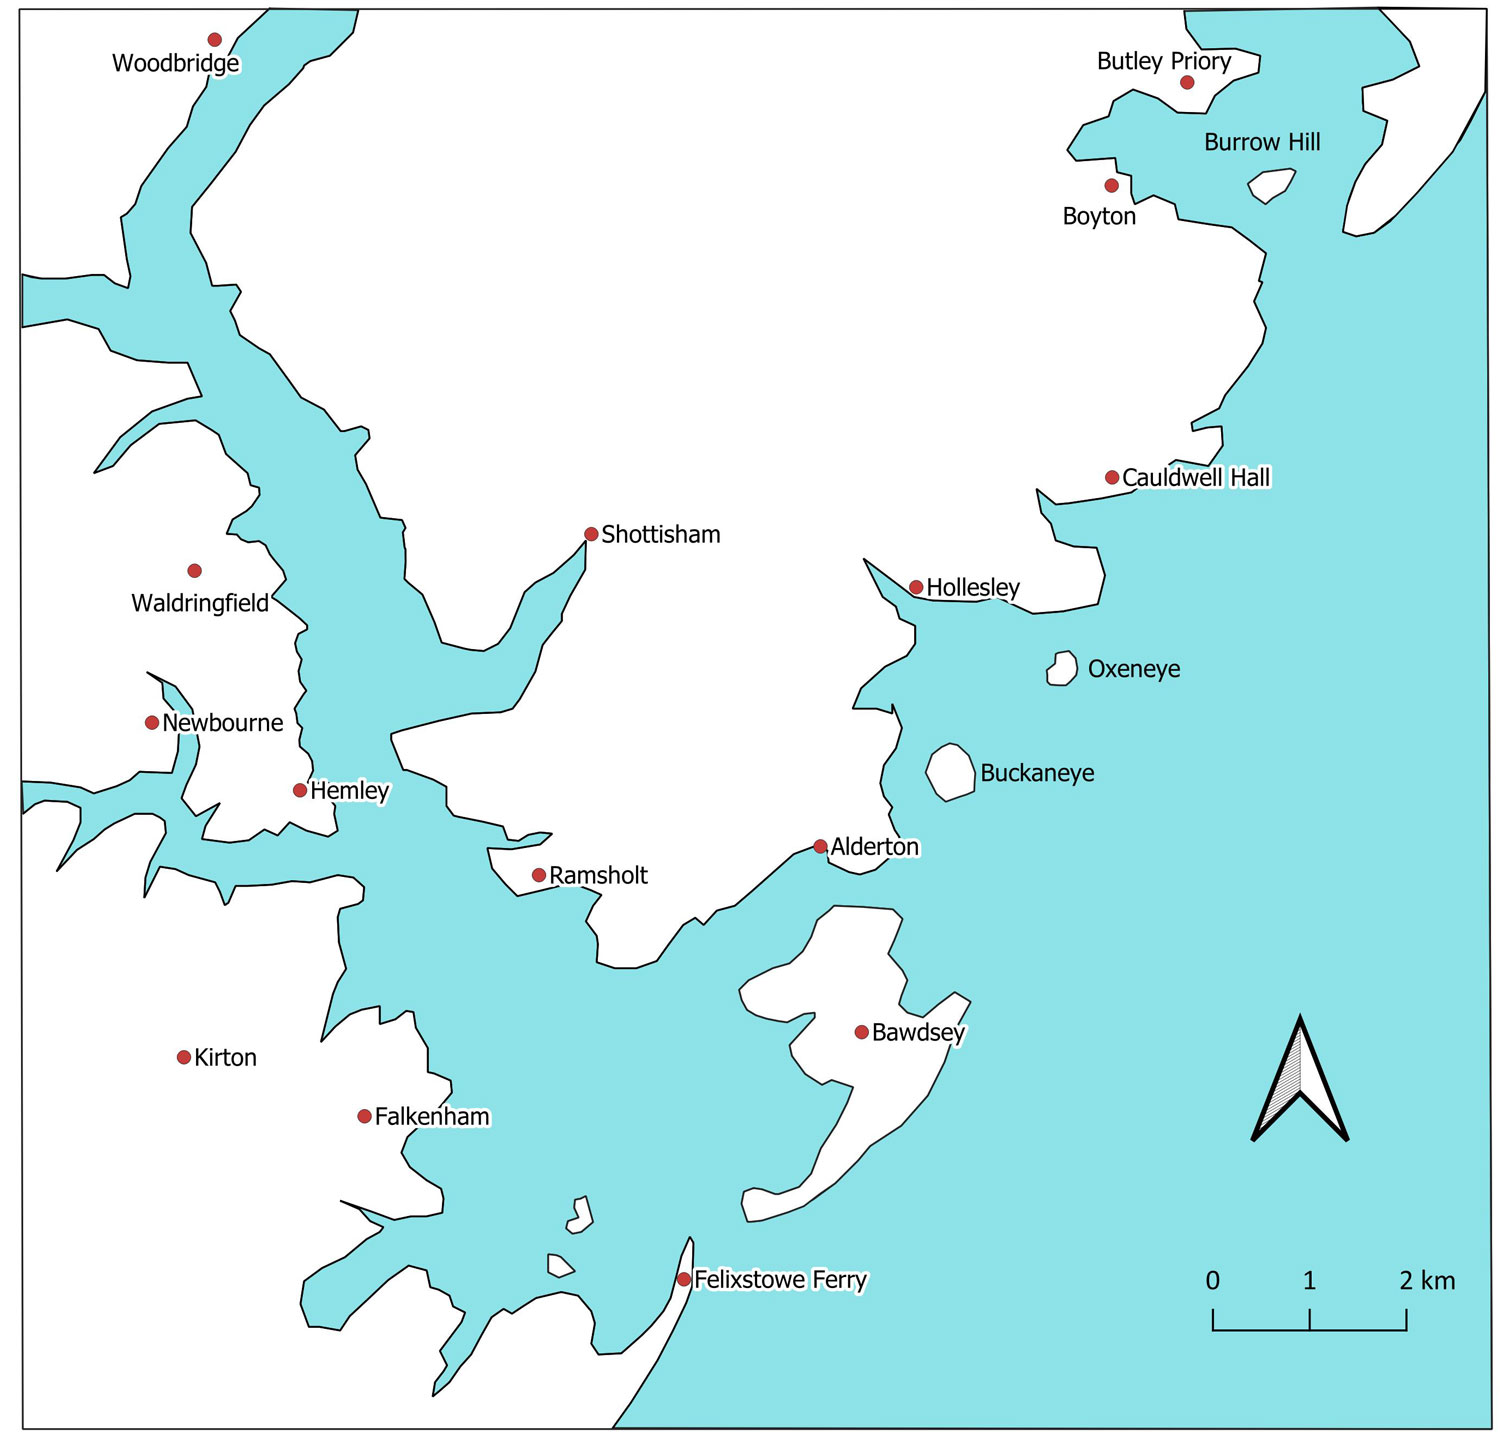 The High Tide line in the Study Area according to LIDAR. This is Figure 28 in the SIAH article. |
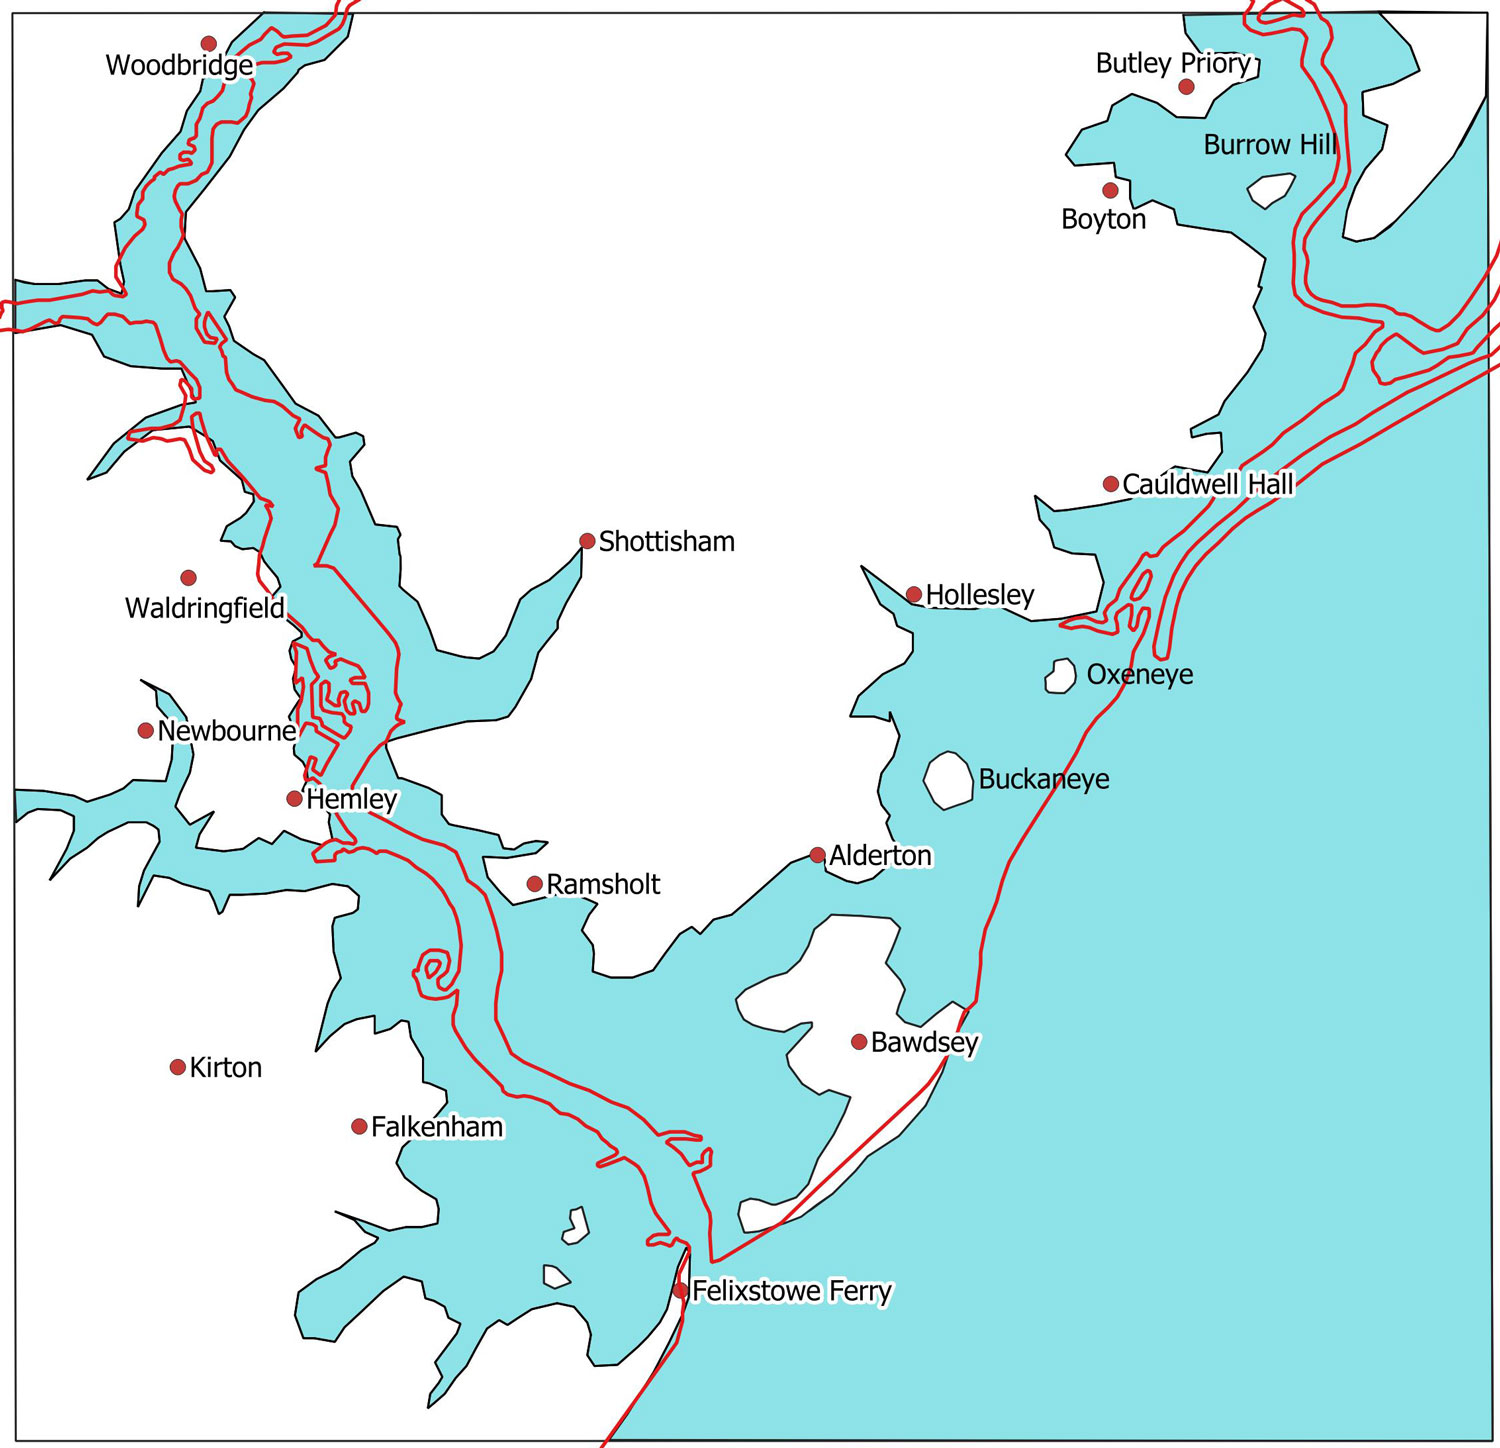 The High Tide line according to LIDAR, overlaid by the modern coastline shown in red. This indicates that much of the inland area here today is below sea level and liable to flooding. |
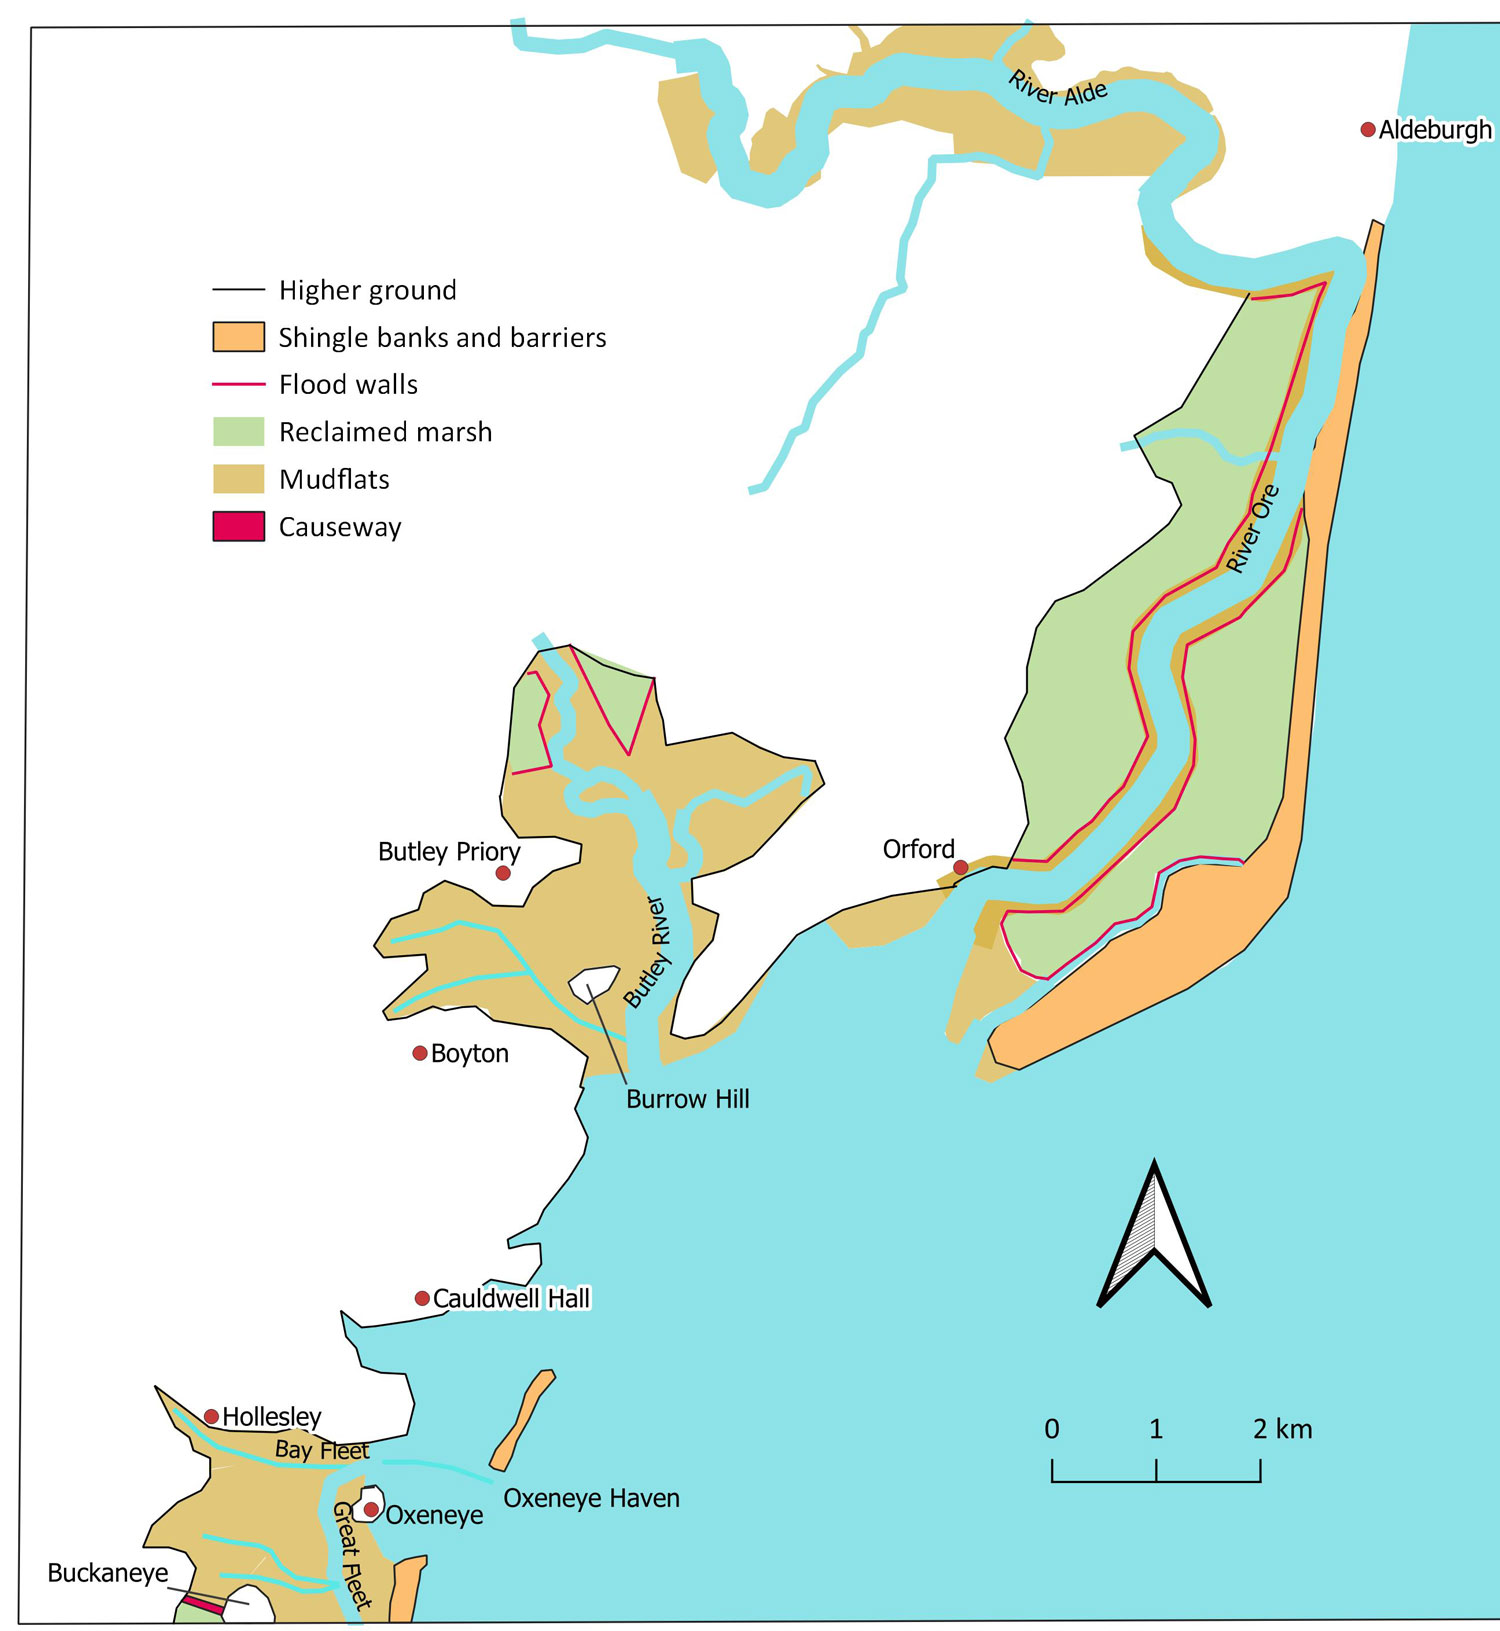 Orford Ness seen in about 1170. This is Figure 29 in the SIAH article. Even at this early date river walls had been established in places to allow some reclamation. Hollesley is still a port at this time. |
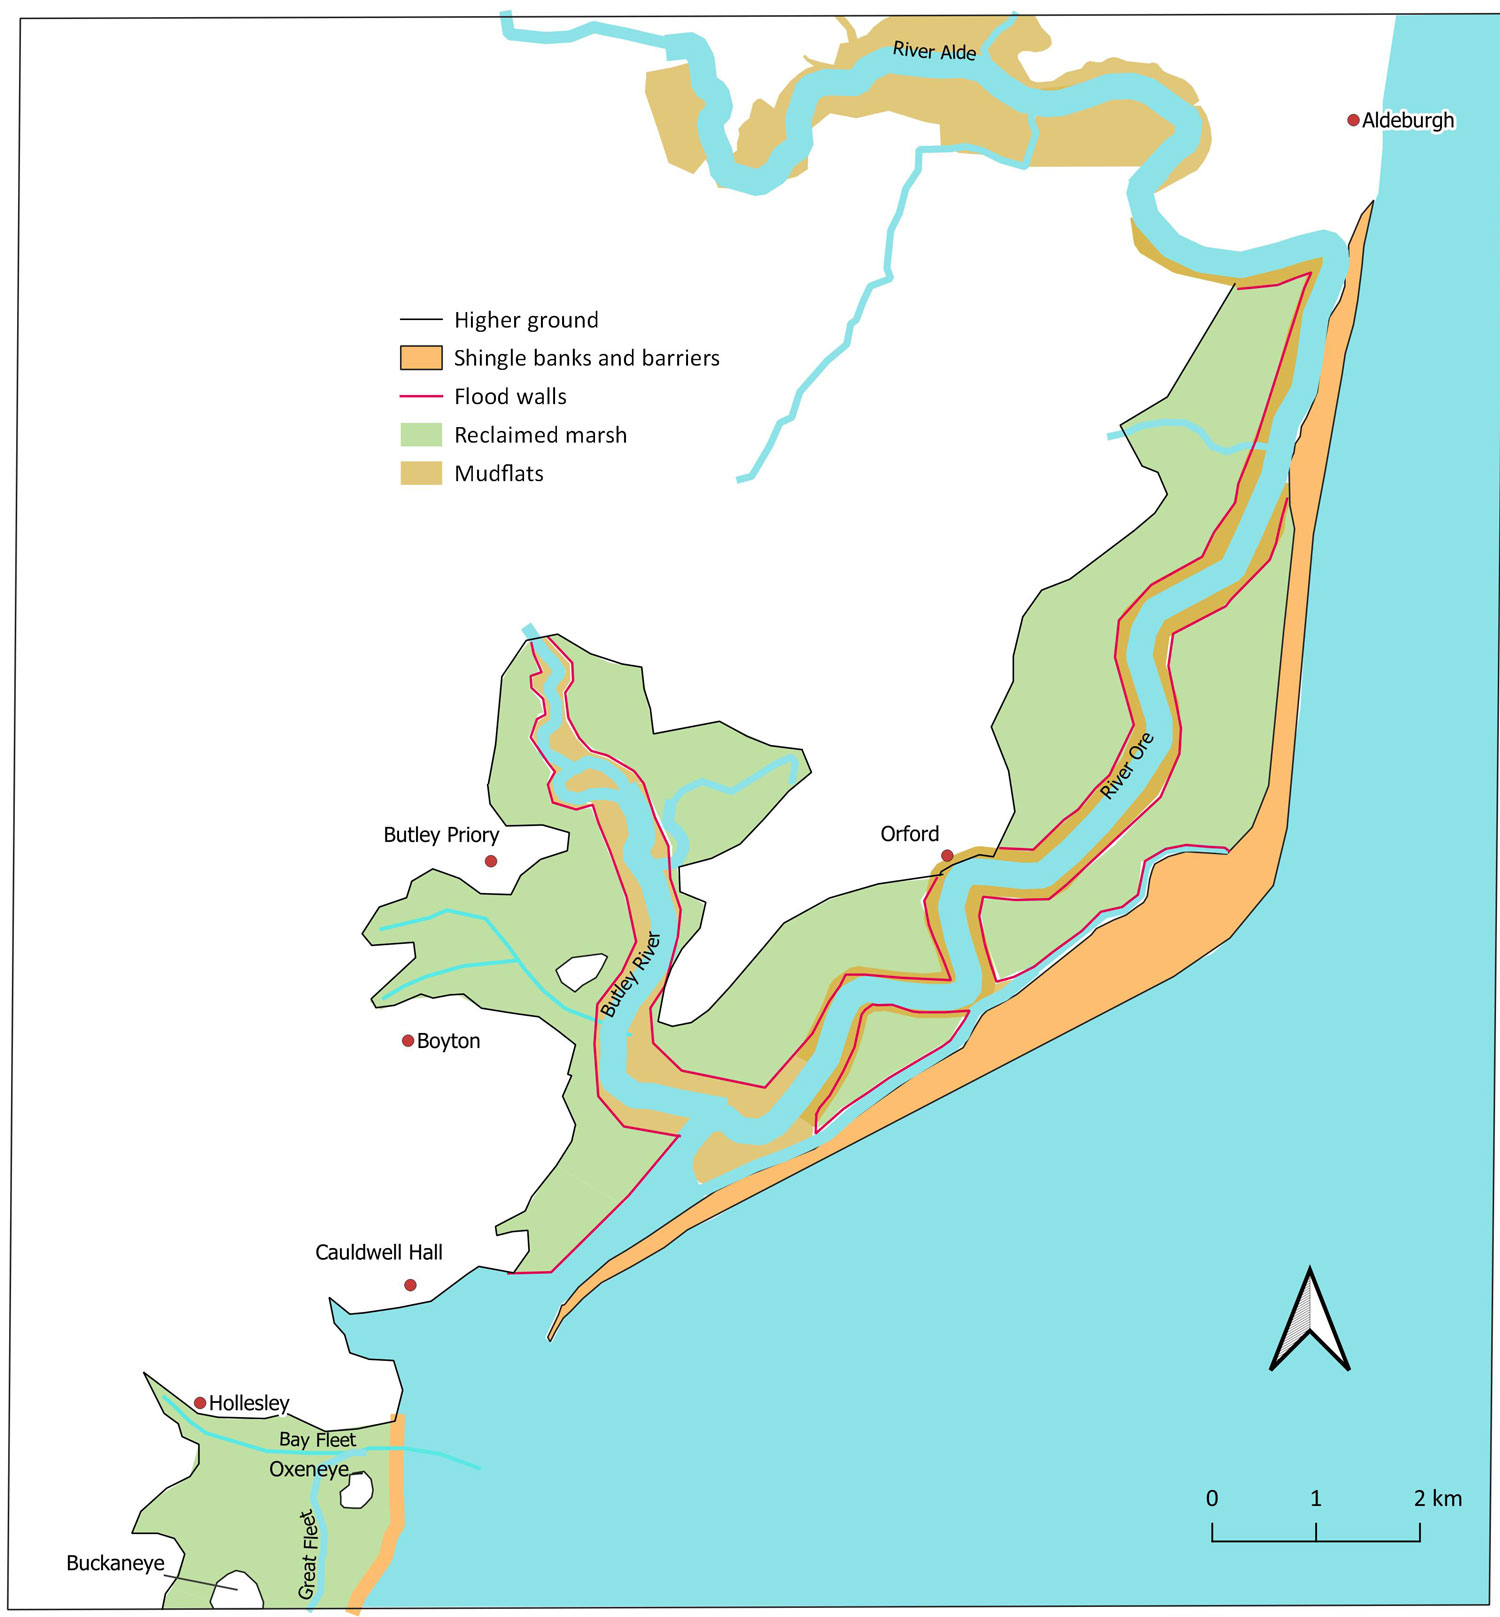 Orford Ness seen in about 1600. This is part of Figure 29 in the SIAH article. The shingle bank known as Orford Ness had extended south westerly for several kilometres by 1600. This has encouraged further land reclamation within its lee. The Butley River no longer drains to the sea, but joins to the River Ore. Hollesley is now landlocked. |
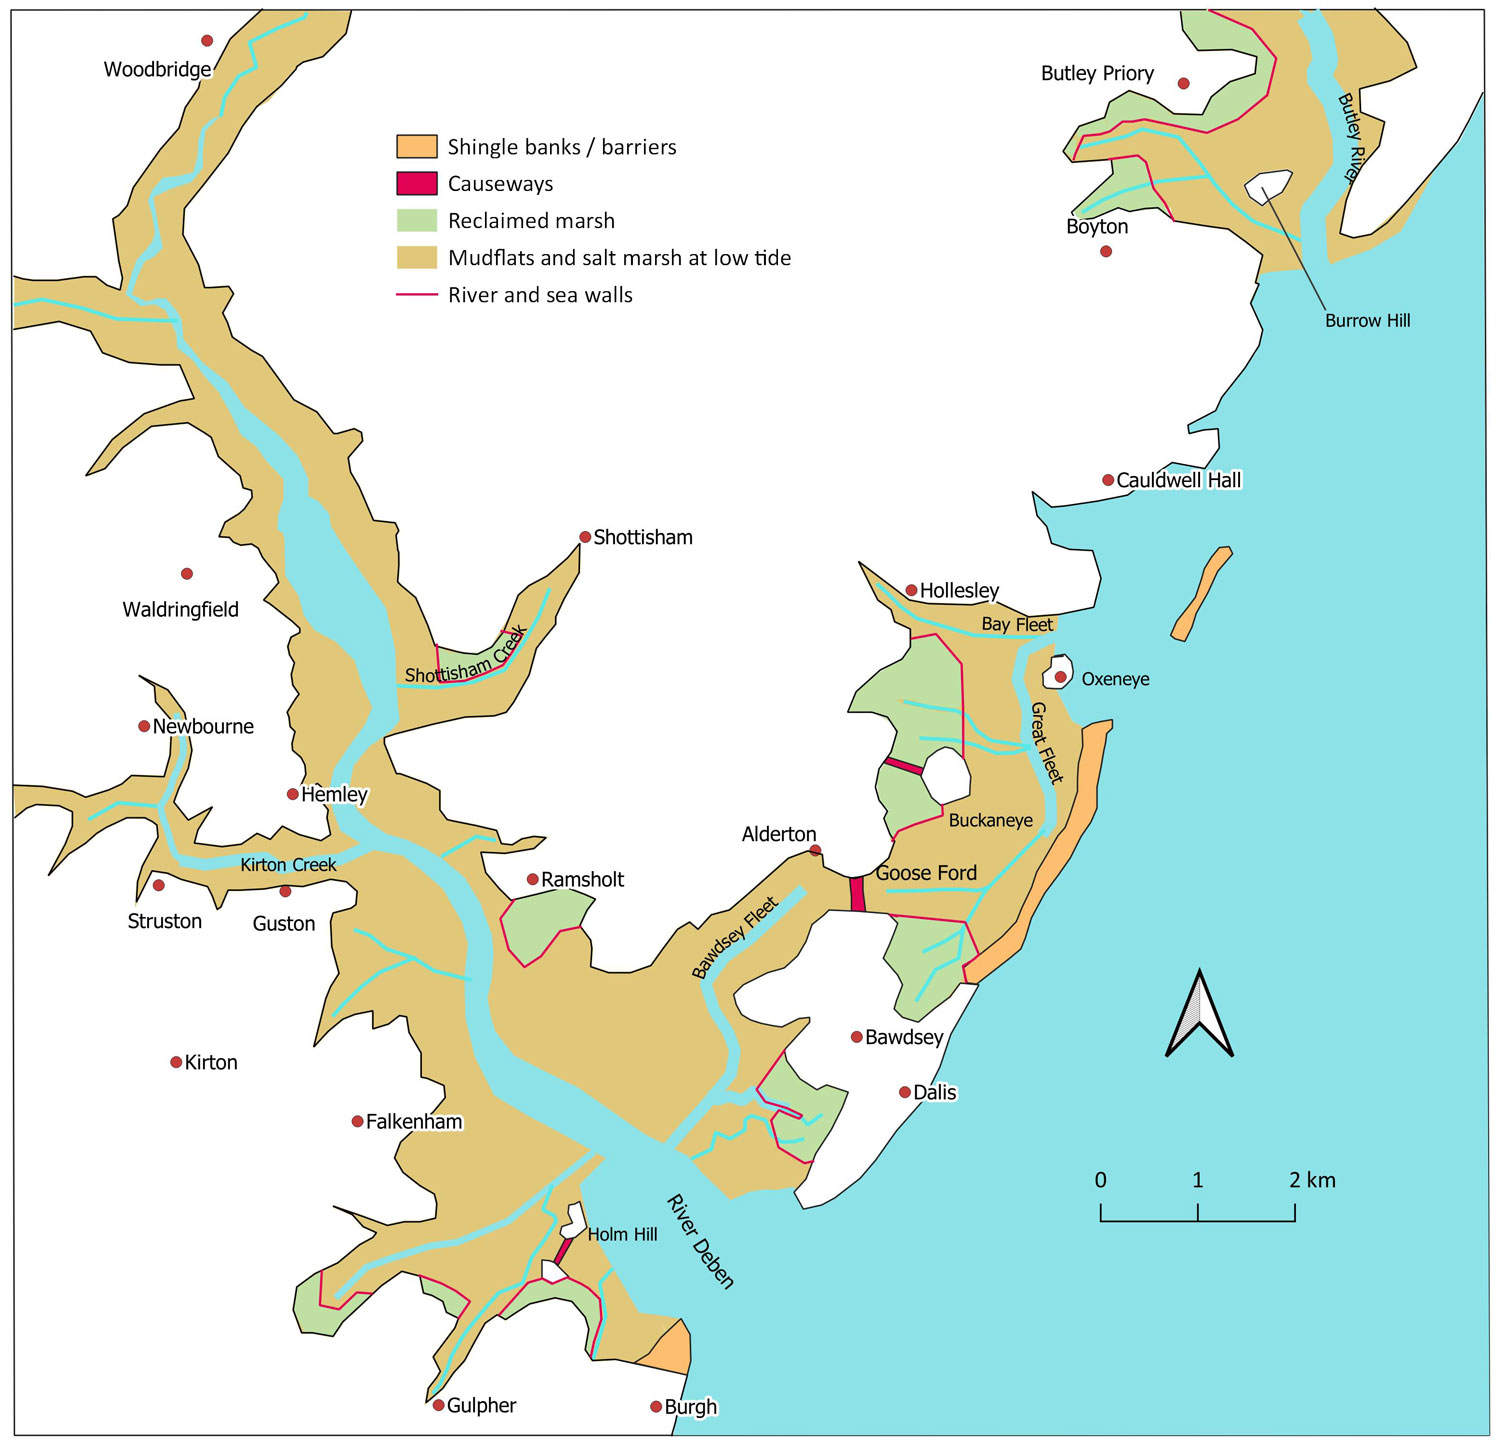 The River Deben and the coastline in around 1250. This is Figure 30 in the SIAH article. The port of Goseford is at its height, although whether it was a conglomeration of ports around the Gulpher to Oxeneye area or a specific location yet to be identified is still unclear. After this date there was a major increase in storms causing large fluctuations in the coastline with breaches followed by depositions. The 1280s saw the most extreme storm events. |
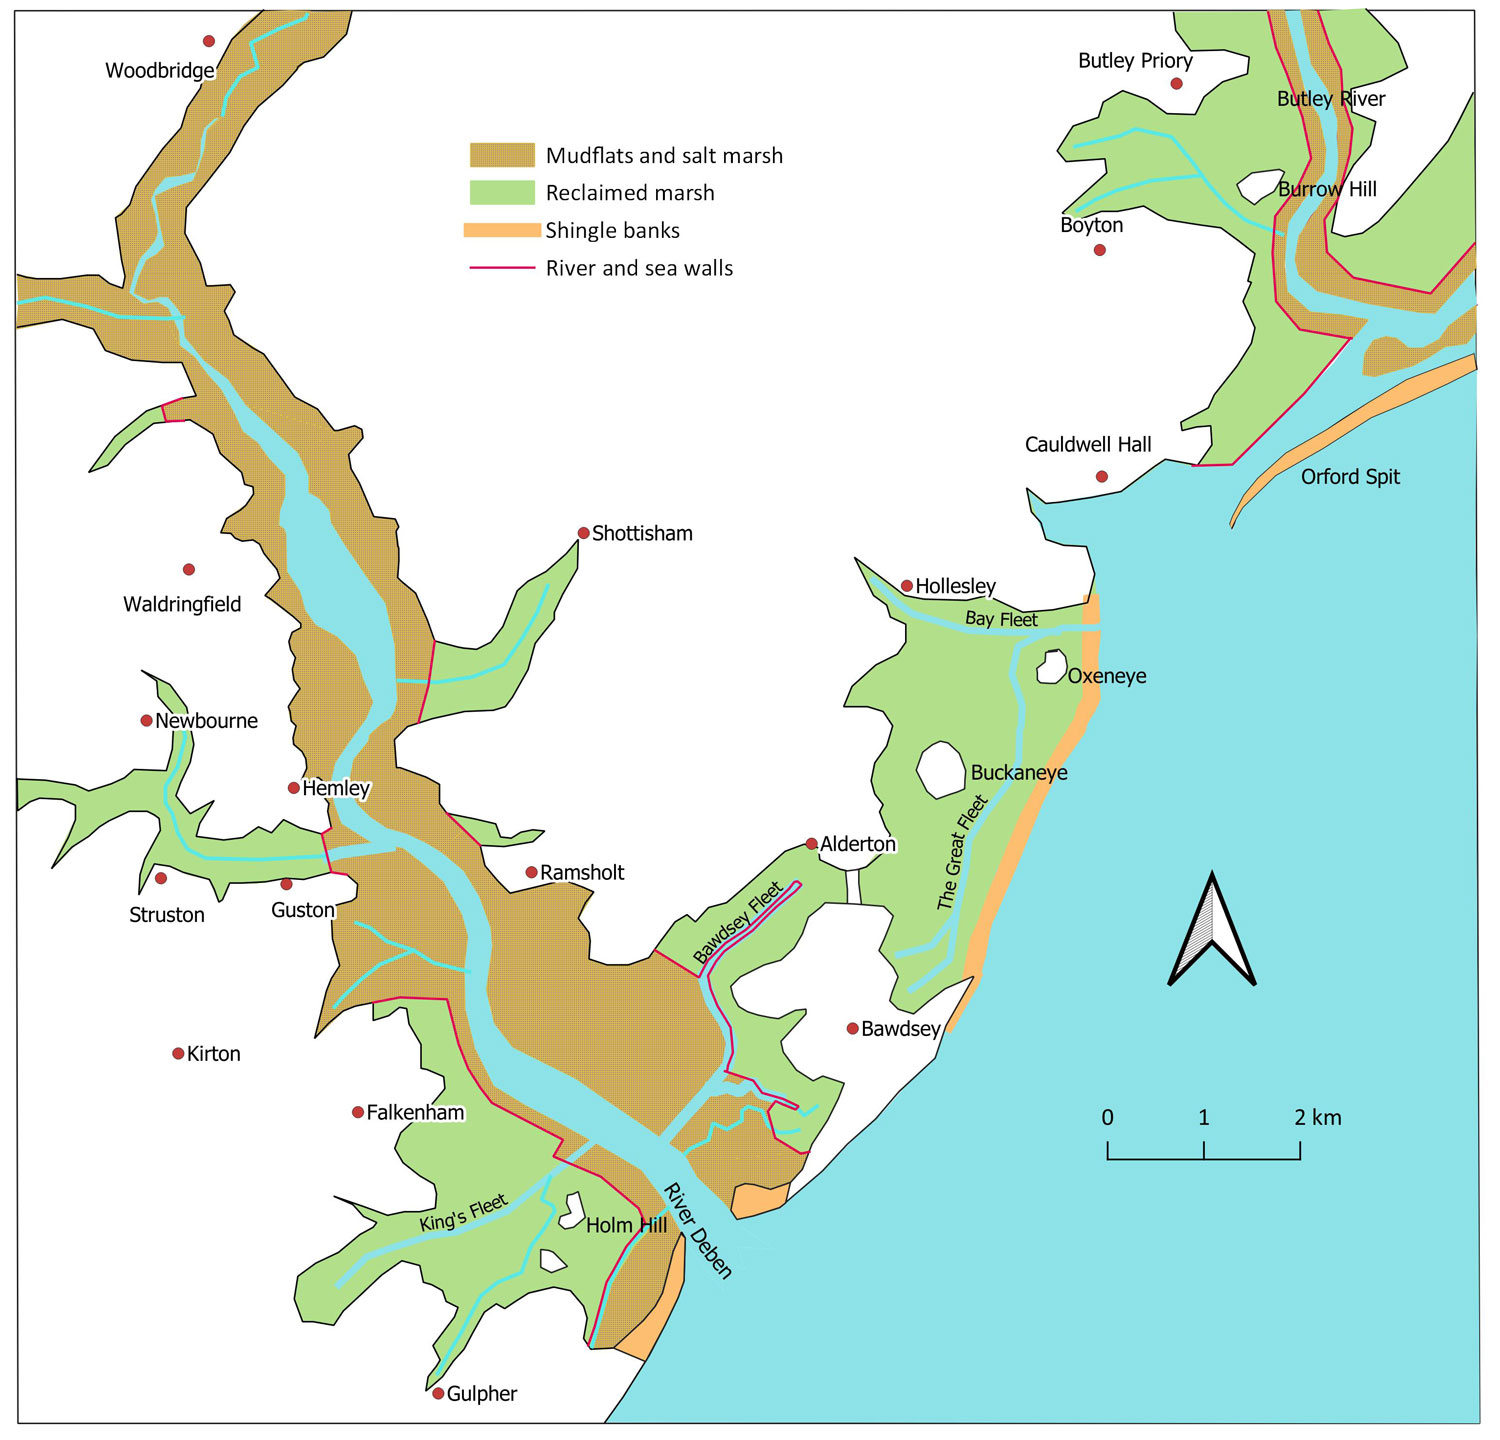 The The River Deben and the coastline by around 1600. This is Figure 31 in the SIAH article. While deposition has encouraged further land reclamation, Bawdsey Cliffs have experienced erosion. Goseford port is now associated with the Deben and Bawdsey Fleet area as Oxeneye has become cut off from the sea. |
Page: 1 |
|
These maps were drawn using the Open Source mapping program called QGIS for "The Transformation of the Suffolk Coast c1200 to c1600 from Orford Ness to Goseford" by Mark Bailey, Peter Wain and David Sear. Proceedings of the Suffolk Institute of Archaeology and History, Volume 45, Part 1 2021.
Page created by David Addy, 2nd February, 2024
|
| Go to the Maps homepage | Last Updated 2nd February 2024 | Go to Main Home Page |