 |
 |
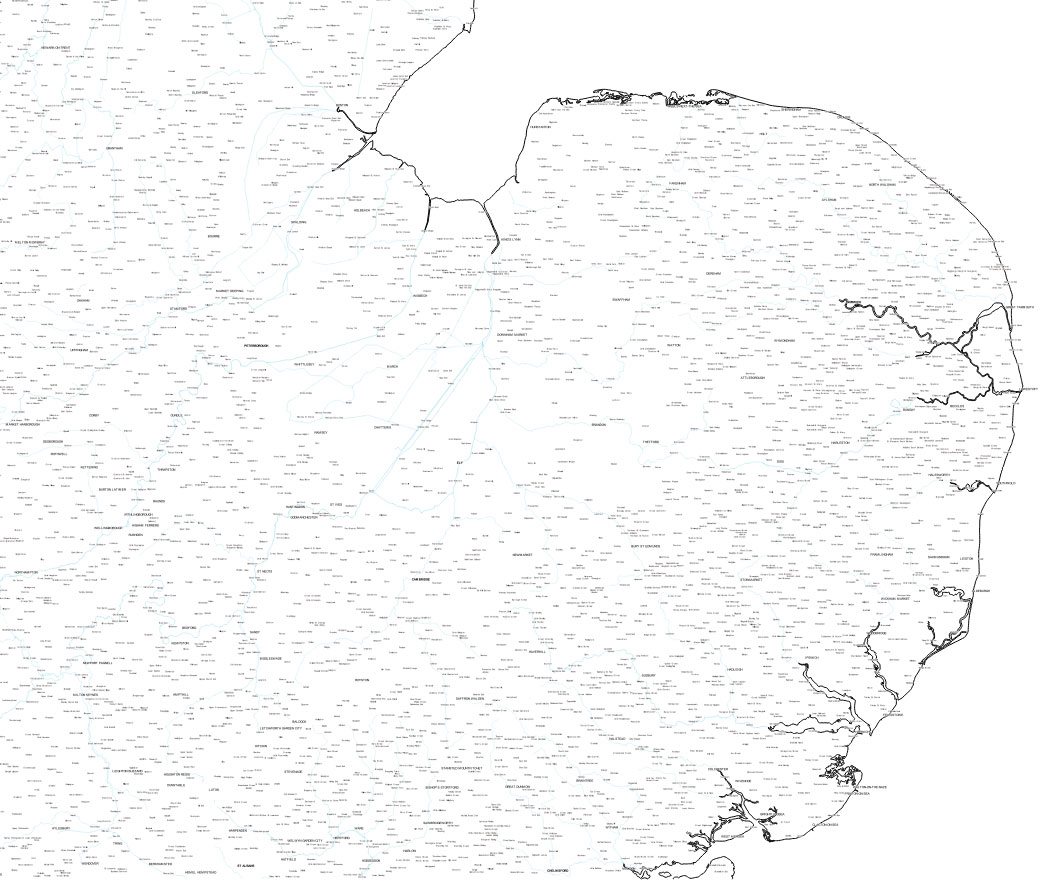
We need to clip the OS Strategi layers called 'coastline', rivers_line, and 'settlement_seed' using our already created clip layer of East Anglia. So load your original OS Strategi files of Britain, and add a copy of the Clip layer. Then for each of these three layers apply 'Vector/Geoprocessing Tools/Clip...', as before. However, do not add them to the Strategi canvas, (ie uncheck the load to canvas box), but navigate to the new location where you are building your topographic map to save East Anglian clipped versions of the files.
The .QML files supplied by the Ordnance Survey are very sophisticated and are designed to work at a wide variety of scales, even if too small to be readable at the regional scale at which we want our maps to work.
So working with our new clipped files, we will change the OS styles to suit our purpose.
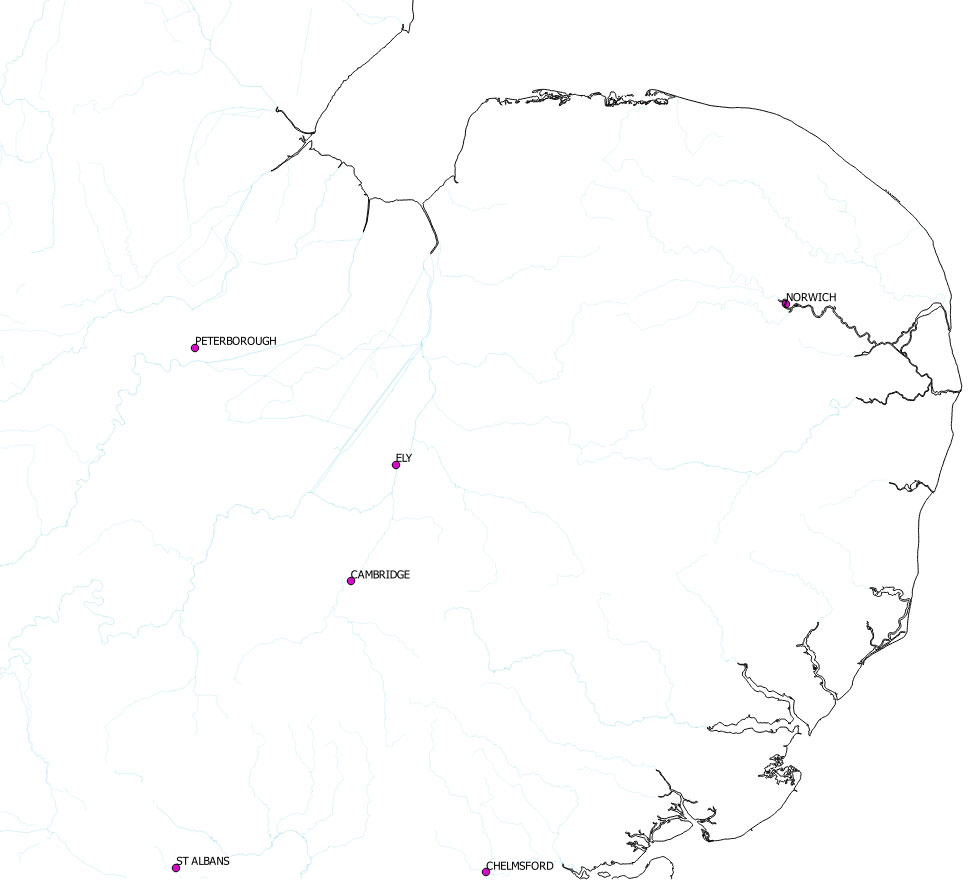
Double click on the 'coastline' layer name to open the Layer Properties and select the 'Style' tab. This should be coming familiar to you by now. To copy my map you want to have the coastline in black, so click on the small colour box and select black from the available colours. To make the coastline more visible change 'Unit' to millimeter, and 'Width' to 0.26000. Click 'Apply' to see the change, then click 'OK' when happy.
On the 'rivers_line' layer, you may like to remove the check mark next to 'Minor River' in the Layers panel if you have imported the OS stylsheet for this layer. This helps to de-clutter the layer. You may wish to deepen the colour blue on the river layer, but I would wait until the final map to see how it looks.
As for the 'settlement_seed' immediately uncheck the 'Village Attribute Point' to remove villages at this East Anglian wide scale.
 |
In QGIS, select 'settlement_seed' layer, right click and select 'Remove'. Then navigate to where the files are stored and delete the file 'settlement_seed.qml' to remove the OS styling. Then return to QGIS and 'Layer/Add layer/Add vector layer' and navigate to and select 'settlement_seed.shp', which now loads without a style. QGIS will apply a default style and the map will be populated by tiny coloured circles.
The easiest way to proceed is to simply display the cities, without towns or villages. Double click on the 'settlement_seed' layer name in QGIS to open the Layer Properties dialoge. Select the 'Style' tab. Now change the top left box to 'Categorised' and in the 'Column' box select 'LEGEND'. Now click 'Classify' and the style will appear under'Symbol', 'Value', and 'Legend.'
To leave only cities visible, uncheck the 'x' in the boxes for 'Landmark Attribute Point', Town Attribute Point', and 'Village Attribute Point'. Now the map should show just a few designated cities.
 |
| Go to DIY digital mapping Homepage |
Page created 12th October 2015 Last updated 14th October 2015. | Go to Main Home Page |