 |
 |
Here we have the parishes of England and Wales downloaded from the ESDS, (now UK Data Services) website. It shows all the parish boundaries fully georeferenced, and QGIS has allocated a random colour to the polygons. We need not worry about this for the moment, as we will be extracting what we want and then processing the results.
 |
By opening the attribute table for this data, we can see a variety of columns containing information about each parish. This is done by a right click on the layer name shown in the QGIS 'Layer' panel, and selecting 'Attribute table'. The county name is in a column headed GAZ_CNTY, and this is the first way in which data can be selected.
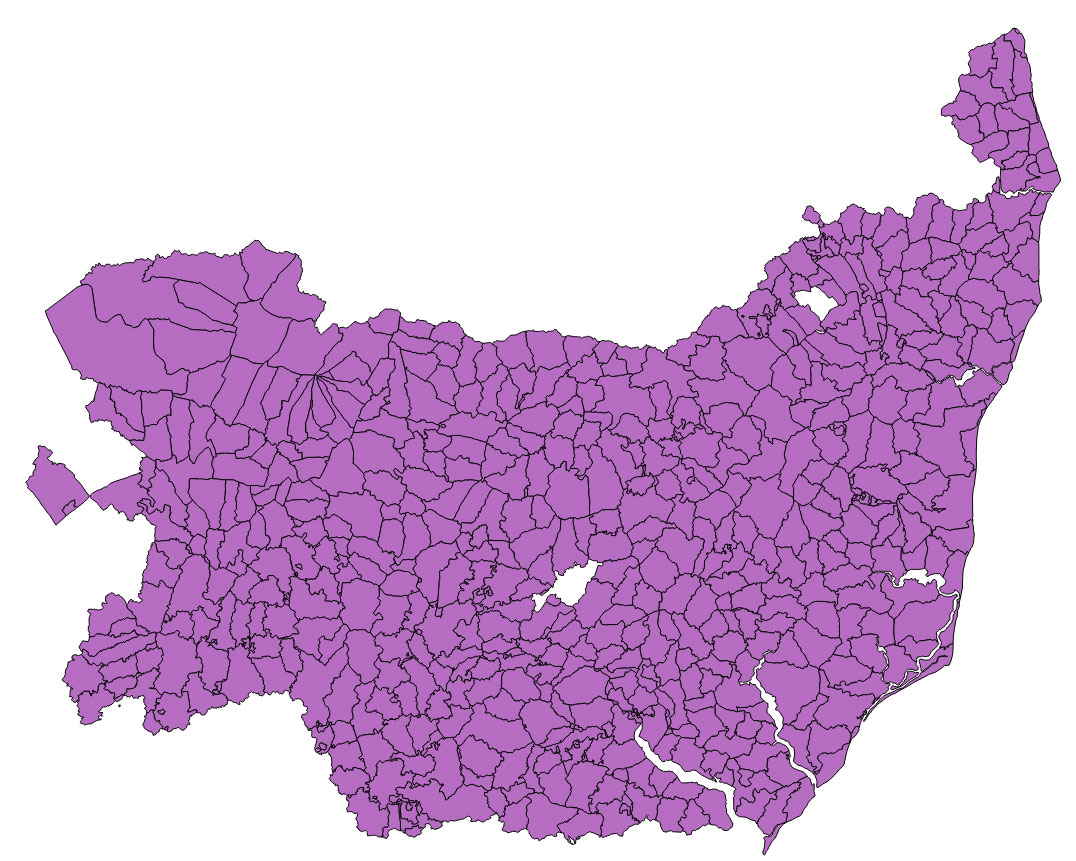
Click on 'Select by expression', and construct the expression "GAZ_CNTY" IS 'SUFFOLK'. Then click on Select and the appropriate parishes should turn yellow on the map, and will be highlighted in the table.
To extract the Suffolk parishes, and to make a new layer of them, once again right click on the layer name, and select, 'Save as'. In the dialogue which opens, check the box 'Save only selected features', and browse to the folder where you wish to save the new layer.
You now have a layer of Suffolk parishes and can work with that, closing the England and Wales layer. Unfortunately the data is not perfect, and there are a few holes visible. These include Creeting St Mary, South Elmham All saints and St Nicholas and South Elmham St James. Stowmarket also seems to be missing its name.
 |
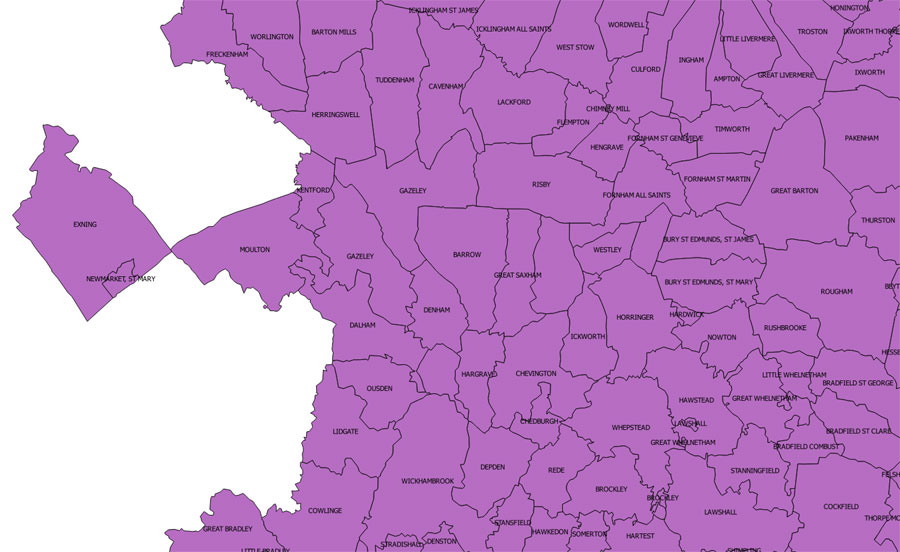
It would be useful to see the names of the parishes on the map. This is achieved by the process known as styling. Double click on the layer name and a properties dialogue opens, showing a range of data attached to the layer. Click on the 'Labels' item in the menu shown and you can control which attribute can be selected to make the label, and the size of font, colour, scale at which the label becomes visible etc.. Click on 'Label this label with..' and select PAR in the drop down menu. Also click on 'Scale based visibility', and amend the Maximum to 150,000. This should result in names becoming visible only when you are zoomed in to 150,000 scale or less. If you omit the scaling the names will make an overlapping jumble at scales which are zoomed out at smaller scales than 150,000 :1.
 |
| Go to DIY digital mapping Homepage |
This page created 17th September 2015 Last updated 17th September 2015. | Go to Main Home Page |