The QGIS logo

Making digital maps at home
How to use LIDAR data

Introduction

Lidar originated in the early 1960s, shortly after the invention of the laser, and combined laser-focused imaging with radar's ability to calculate distances by measuring the time for a signal to return. Lidar (also written LIDAR, LiDAR or LADAR) is a remote sensing technology that measures distance by illuminating a target with a laser and analyzing the reflected light. The term LIDAR is usually thought to derive from an acronym of Light Detection And Ranging, but seems originally to have come from a combination of "light" and "radar".

NASA satellites use LIDAR to make topographic surveys of the earth from space, but for our purposes we are mostly interested in the surveys made by the Environment Agency from low flying aircraft, primarily to map flood risk areas in this country. About 70% of the country has been surveyed in this way, primarily along river valleys.

LIDAR surveys are usually conducted so as to produce a resolution of surface difference of two metres, but resolutions of up to only 25 centimetres may also be available for some areas. The laser system employed cannot see through trees to the underlying surface, but uses algorithms on each returned pulse to remove the effects of trees.

A digital terrain model, or DTM, can be produced in this way to give a fairly accurate view of the ground surface. A digital surface model or DSM, will include the tops of trees and buildings. Both models are made available to end-users as a special form of raster file, known as an ASCII grid, with a file suffix of .asc.

There is no need to be afraid of Lidar data as all the providers process the data into an ASCII grid, and using this you can proceed exactly the same as using elevation data supplied by the Ordnance Survey.

Introduction to these Maps

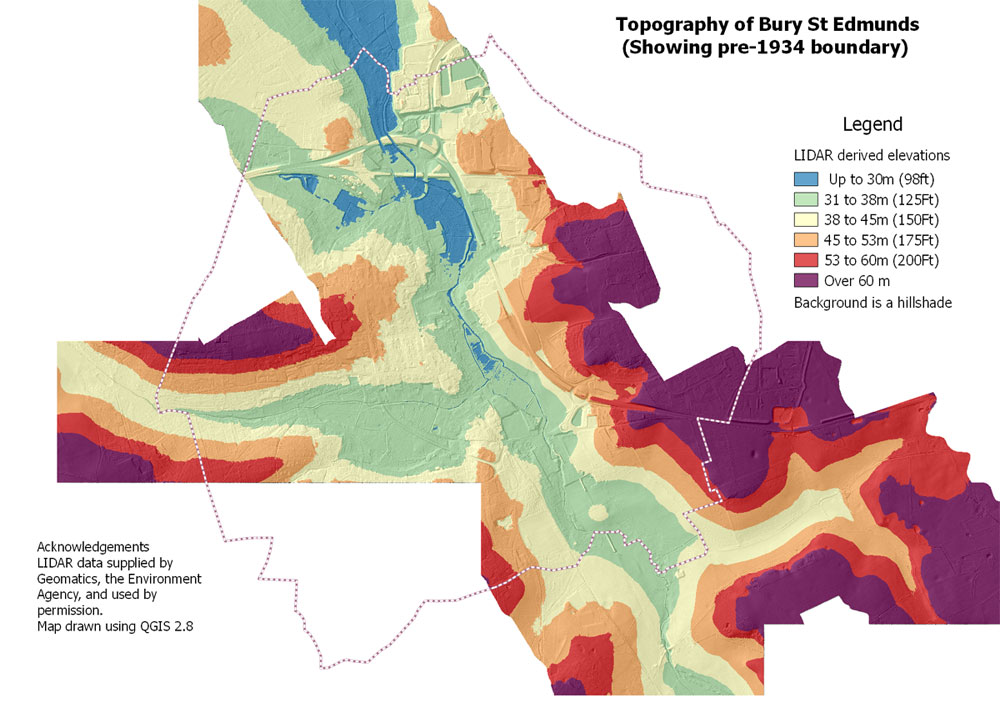
This example of a map produced within QGIS demonstrates some of the power of using LIDAR imaging, but also some of the difficulties, the most prominent of which is the current restriction of data to the river valleys. This leaves areas of Bury St Edmunds not covered by this method.

The elevation bands selected here are a matter of choice, as the raw data allows a one metre discrimination to be available. Although this sounds attractive, it would require a large number of colours to achieve this, and would result in a very unreadable final map.

The Lidar data is represented by the colour bands, and a hillshade layer created from the same ASCII grid has been added 'below' the Lidar layer to supplement the detail available.

The blue areas are the most low lying, and would be the first areas to flood under heavy rainfall conditions. The River Lark is visible, and so is the A14 trunk road and its associated roundabout. Note that all this detail is provided solely by elevation data. The river and the A14 have not been drawn in any other way.


Sources: All maps prepared using Ordnance Survey Opendata, while the LIDAR data is available at the Geomatics website of the Environment Agency.


Go to DIY digital mapping Homepage This page created 26th August 2015
Last updated 10th September 2015.
Go to Main Home Page