 |
 |
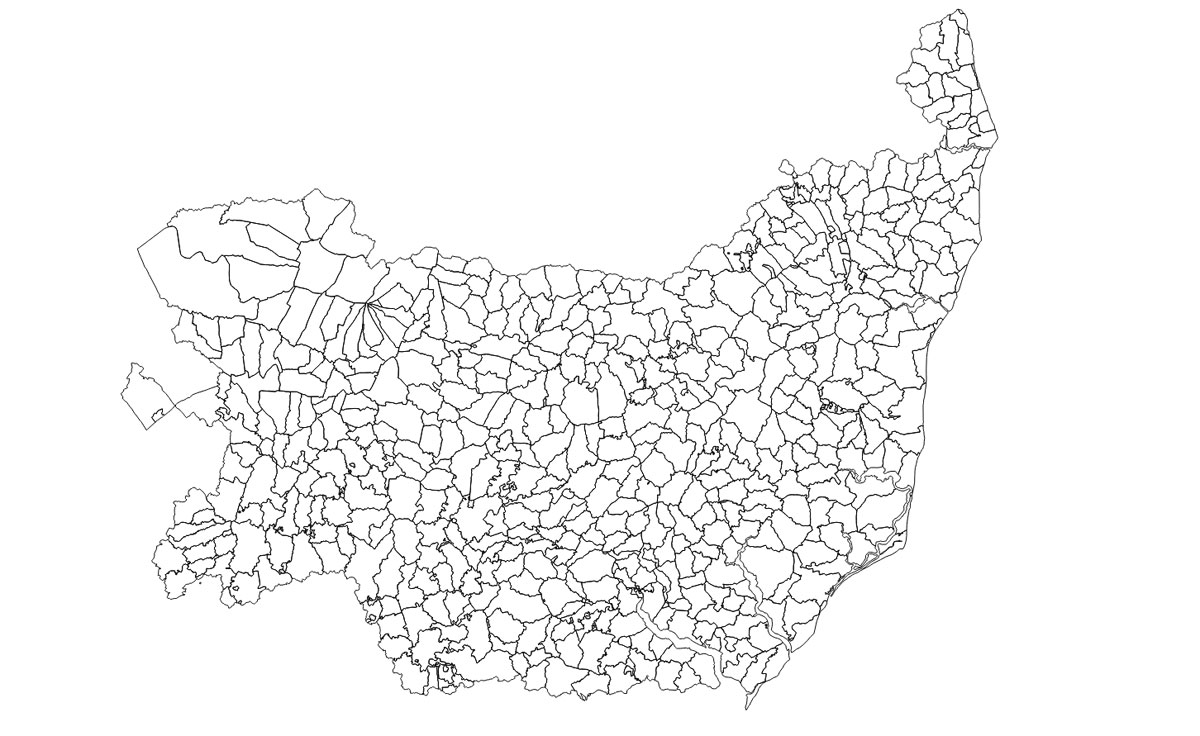
This example of a map produced within QGIS shows the area of the county of Suffolk as it was in the mid 19th century. The parish boundaries are shown, and the styling of the layer has been changed to make each parish have what is called a 'transparent fill'. This is achieved by clicking on the layer name to open the layer properties dialogue. Open the tab marked 'Style'. Click on the small coloured box labelled 'Simple fill'. This opens a new view. Look for 'Colors Fill' which also contains the fill colour, but now clicking on the drop down menu produces a list of possible colours, but also allows you to select' Transparent Fill'.
The transparent fill is often preferable to a coloured fill, particularly when more than one layer is needed, and features need to show through from one layer to the next.
 |
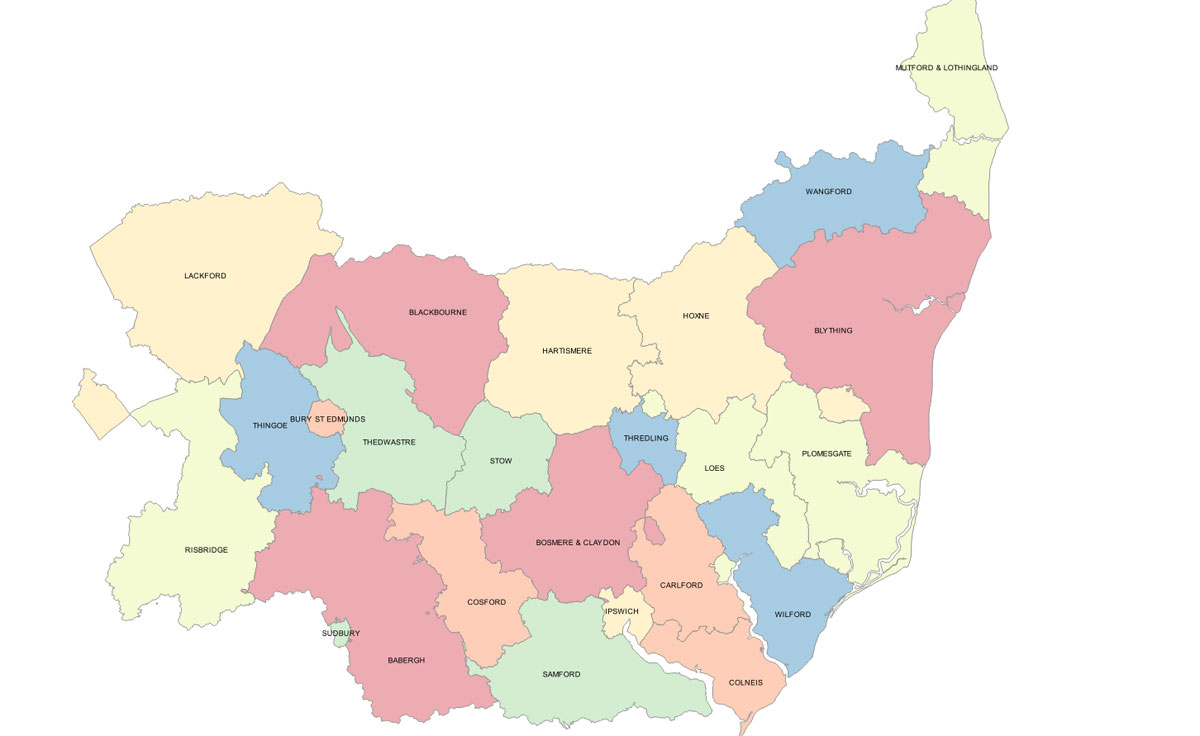
If you have now allocated each of your parishes to the relevant Hundred, you will want to generate a layer which actually now shows the individual Hundreds which you have laboriously allocated. Your parish layer's attribute table now contains the column HUNDRED with all the appropriate entries filled in.
Along the top row of menus on the QGIS main window, select Vector/Geoprocessing Tools/Dissolve. This opens the 'Dissolve' dialogue. For the 'Input Vector Layer', select the name of your parish layer from the drop down list. It will be the layer associated with the attribute table containing the Hundred names. For the'Dissolve Field' select HUNDRED from the drop down layer.
Now decide on a name for your new layer of Suffolk Hundreds, and browse to the folder in which you want to save it, and type the new name into the file name box that appears. Save it and the new path should appear in the Dissolve layer dialogue box. Check 'Add result to canvas' and click OK.
Your new layer will appear and overwrite the parish layer in the QGIS main window, with all hundreds coloured by QGIS in a single default colour.
Double click on the layer name of your newly created layer, and select the 'Style' tab in the Layer Properties dialogue. The quickest and easiest way to colour up your Hundreds is to select 'Categorised' from the drop down at the top left of the style tab window. In 'Column', select HUNDRED and click on 'Classify'. This action will allocate a colour to every different Hundred listed in your data.
The colours may well be extremely garish. To tone them down a bit, push the 'Layer Transparency'to about 50 percent. Click on 'Apply' to see the result. You can amend the transparency and try changing the colours until it seems acceptable. The click OK to close the dialogue.
 |
If we want to also show the parish outlines this can be done by loading the parish layer and placing it below the Hundred layer. It is probably already in place if you followed the steps outlined above. The transparency of the Hundred layer can be varied to about 30 - 40 percent, depending upon the intensity you want the parish layer to show through. Note that this change of transparency will modify the way the colours appear as well. It is up to you to amend this balance as you see fit.
 |
| Go to DIY digital mapping Homepage |
This page created 22nd September 2015 Last updated 22nd September 2015. | Go to Main Home Page |