 |
 |
Until we apply a style or styles to our data, QGIS will give it a simple fill, with a randomly selected colour. Here we see above that every polygon in the layer is coloured brown by QGIS. As this is a random allocation, your example will almost certainly be given a different colour.
To load the style file we have downloaded, proceed as follows:-
Double click on the Layer Name to open the properties dialogue. Select the Style tab. Down at the bottom left hand side of the style tab, you will see a button marked'Style' containing a small down arrow. Click on this arrow to get a drop down menu.
Select 'Load style...' and then browse to where you have saved the .sld files. If the folder appears blank, make sure that the filter button at bottom right is changed from 'QGIS Layer Style Fill (*.qml)' to 'SLD file (.sld)'
Seect the file marked, "gb_625k_superficial_geology_polygons.sld", and click 'Open'.
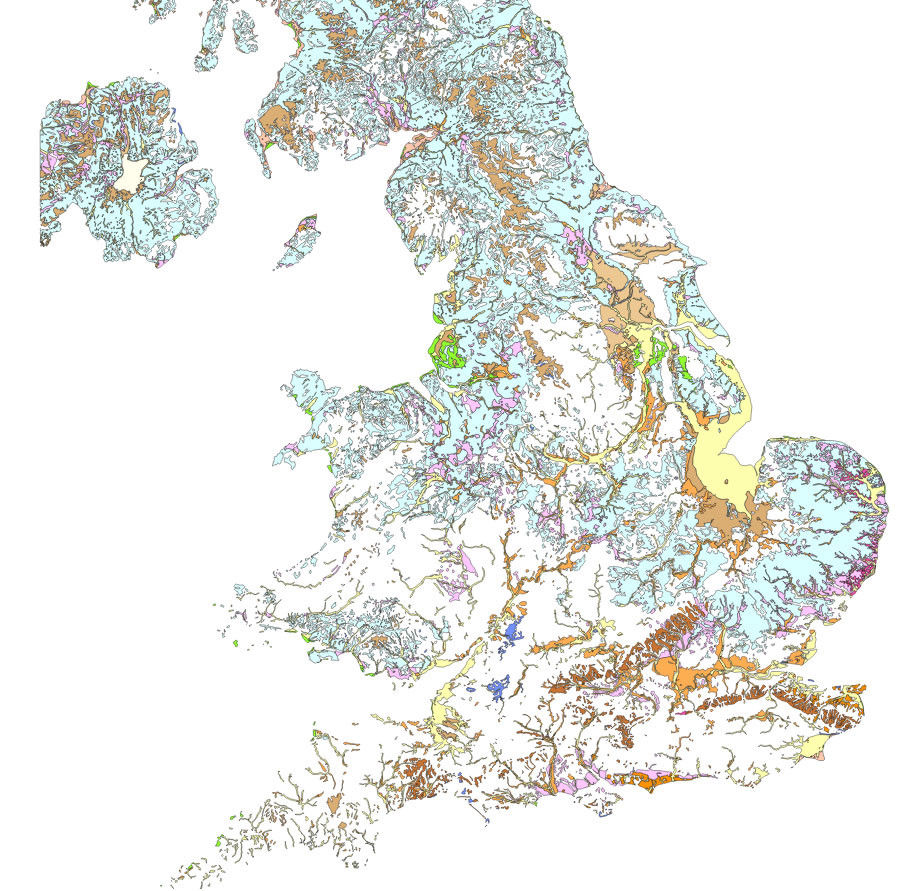
Once you have done this, you will see that the 'Simple fill' has been replaced by a 'Rule-based' style with an array of 14 different colours. Click Apply and then OK and the map should look like this.
 |
In order to clip off the part we want, we have to create a new layer, containing a new 'polygon' which will be used as the "scissors" to cut off the material we wish to keep.
The process begins by selecting: Layer/Create Layer/New Shapefile Layer.
This will open a dialogue entitled, 'New Vector Layer' which requires some input from you. In the 'Type' section, select 'polygon'. Check that the Coordinate Reference System drop down menu says, 'EPSG:27700, OSGB 1936 / British National Grid.
Ignore the rest and click OK.
A new dialogue opens which requires you to give your new file a name, such as 'cliplayer', and decide where you want it stored.
The name of the layer will appear in the list of layers. We now need to draw our polygon around East Anglia. Click on the icon of a pencil, which turns on the editing feature, and makes the appropriate tools available to us. Find the 'Add feature' button, and click it.
The next bit is tricky. Move the cursor to the top left corner of the area which you want to include. When you are happy left click, and a dot appears on the map of England. Release your click and move the cursor to the top right of the rectangle you require. A string of dots should follow your cursor until you left click on the new point. A line should appear between the two points. Now release that click and move down to the bottom right corner and click again. You should now see a red triangle outlined. Release the click and move to your final point and left click to complete the feature. You must now right click to release the cursor. You will be asked to ID the feature, but you can just click OK. The new polygon should now be a filled square on the map.
Cick on the pencil icon to turn off editing, and you will be asked if you wish to save the new feature, and answer 'Yes' if you are happy or 'No' to have a repeat performance. Here I would also normally change the style of the clip layer to be transparent, as follows:-
Double click on the Layer Name to open the properties dialogue. Select the Style tab. Click on coloured block under 'Simple Fill'. Select the Colours drop down menu and click on Transparent Fill. Finally we come to actual clipping operation.
(Note that this clip layer can be used repeatedly on each of our layers that we want to use in our final production.)
Select 'Vector/Geoprocessing tools/clip....'. A new dialogue appears which requires you to specify 'Input vector layer', which is the name of the layer you wish to clip. Select from the drop down menu. The 'clip layer' is the name you gave to the rectangle you drew to specify the area you wanted. Select it from the drop down menu.
Finally, you also need to name the new layer, or 'Output shapefile' which you wish to create. Do this by browsing to the folder where it is to be stored, and enter 'digmap625_eastanglia' or similar, and click 'Save'. This returns you to the clip dialogue, where it should be checked in the box 'Add result to canvas'. After clicking OK it should appear on your map. Now close the clip dialogue.
Now we have a new layer showing East Anglia's surface geology, but once again it is styled in QGIS default of a simple fill. So once again, load the stylefile marked, "gb_625k_superficial_geology_polygons.sld", and click 'Open'. The map of East Anglia should now be properly coloured up again
The simplest way to isolate the areas of peat and alluvium is to turn off the styles for all the polygons which are not in these two classes. Look for the name of the layer you just created in the 'Layers' window on the left of the program screen. Next to the check mark, (always x in Windows, may be a tick in Linux), is a tiny + or plus sign. Click on this to reveal all the styling information. Every class of colour is checked. Now uncheck everything except 'ALV-CLSS' and 'PEAT-PEAT'.
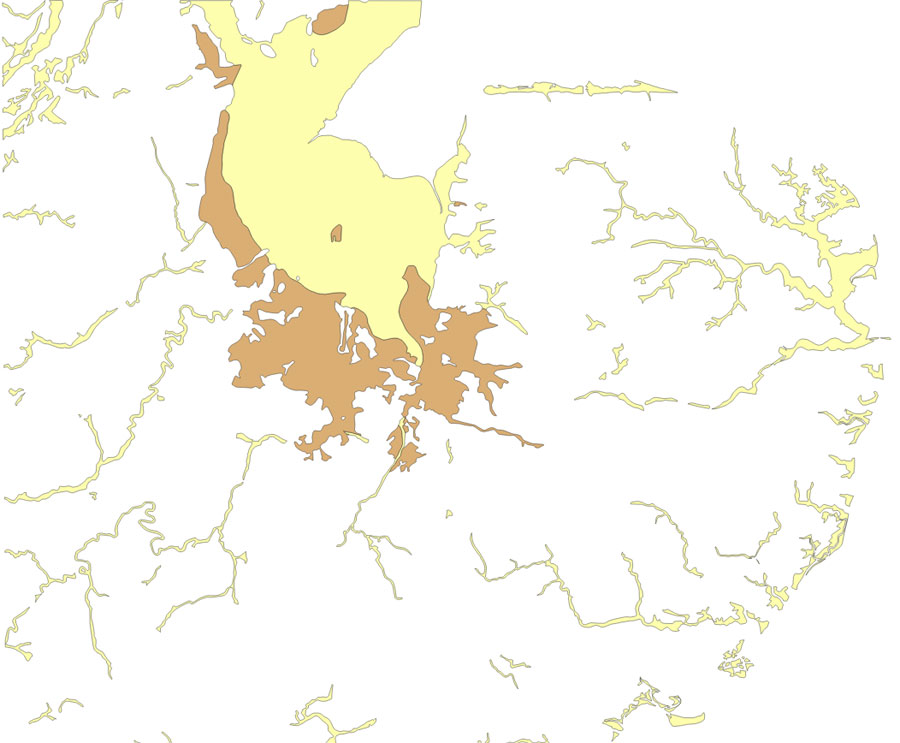
You should now see only areas of yellow alluvium and brown peat. Note that there is no clear coastline. In order to show the coast we will need to find another layer of coast, and a good source will be the OS OpenData Strategi file.
 |
Our map above does show the alluvium and peat features which we want to display as part of a topographic map created in the manner of H C Darby's "Domesday Geography of Eastern England", and later authors such as Dr Sam Newton. However it will be a lot tidier to create a new layer which consists solely of the two features without any other geological features.
We can do this by making use of the attribute table and the 'Select by expression' feature, which is demonstrated in the next section.
| Go to DIY digital mapping Homepage |
This page created 4th October 2015 Last updated 10th October 2015. | Go to Main Home Page |